(Last update: 2010/08/30)
 97 kB JPEG |
Optically transparent silicone phantom for flow studies of the carotid artery bifurcation Idealized model (A) and transparent phantom (B) of a common carotid artery (CCA, 8.0 mm ID) as it branches into the external (ECA, 4.62 mm ID) and internal (ICA, 5.52 mm ID) carotid arteries. The model on the left shows a severe stenosis (diseased constriction) of the ICA, whereas the phantom on the right has a normal (disease-free) ICA bulb. Model geometry: Smith et al, Acad Radiol 1996, 3:898-911 (PubMed). |
 115 kB JPEG |
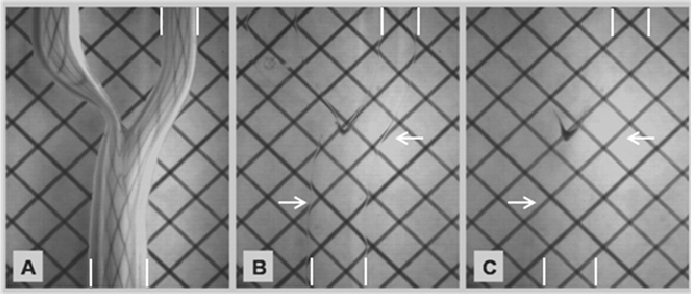
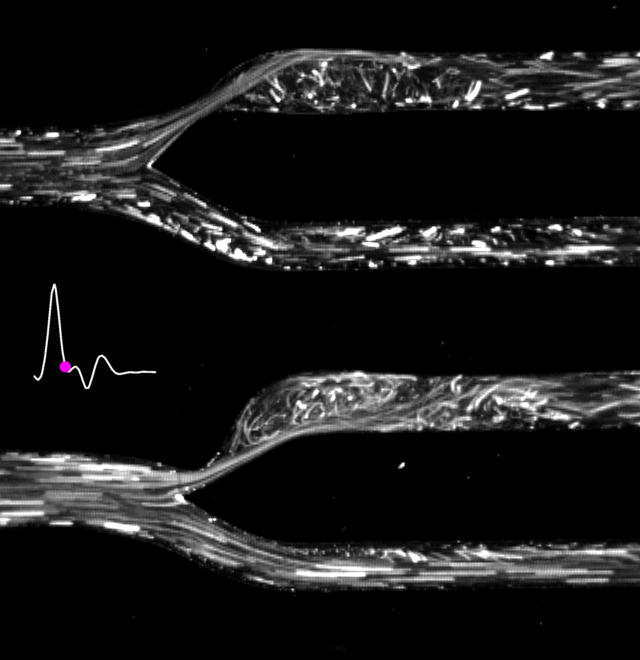
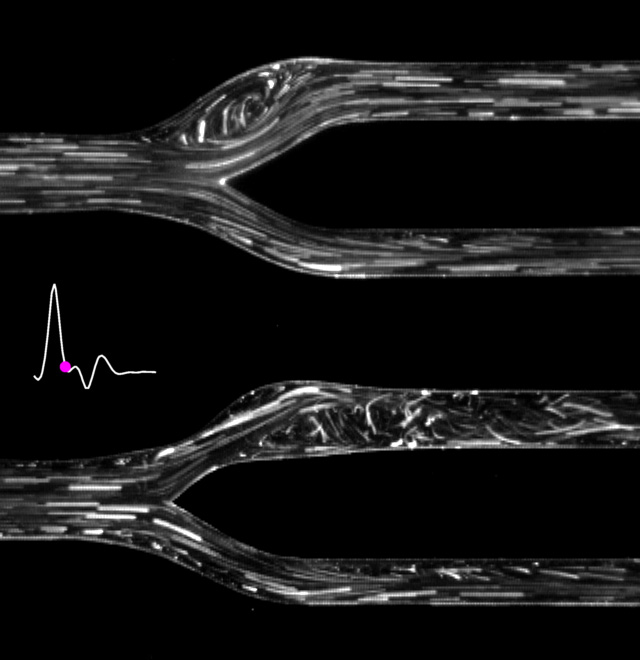
Optimizing the refractive index of a blood-mimicking fluid to match a silicone vascular flow phantom for PIV studies A major difficulty in PIV that affects measurement accuracy is the refraction and distortion of light passing through the interface between the model and the fluid, due to the difference in refractive index (n) between the two materials. The problem can be eliminated by using a fluid with a refractive index matching that of the model. The match in refractive index can be monitored based on distortion of grid lines beneath a phantom filled with (A) air, showing high distortion, (B) nearly matched fluid (n=1.4112+/-0.0001), still showing minor distortion as indicated by the arrows, and (C) optimally matched fluid (n=1.4140+/-0.0001) with no distortion, as indicated by the arrows. Note the vertical white markers, denoting the flow lumen, and the unintentional stain at the bifurcation apex, which provides a convenient landmark here. The fluid was also optimized to achieve a dynamic viscosity of 4.31+/-0.03 cP which lies within the range of human blood viscosity (4.4+/-0.6 cP). Abstract from IEEE EMBS Conference, 2010. (PubMed) Article in Experiments in Fluids: Yousif, Holdsworth, Poepping. EXIF, 2010 |
 368 kB TIFF |
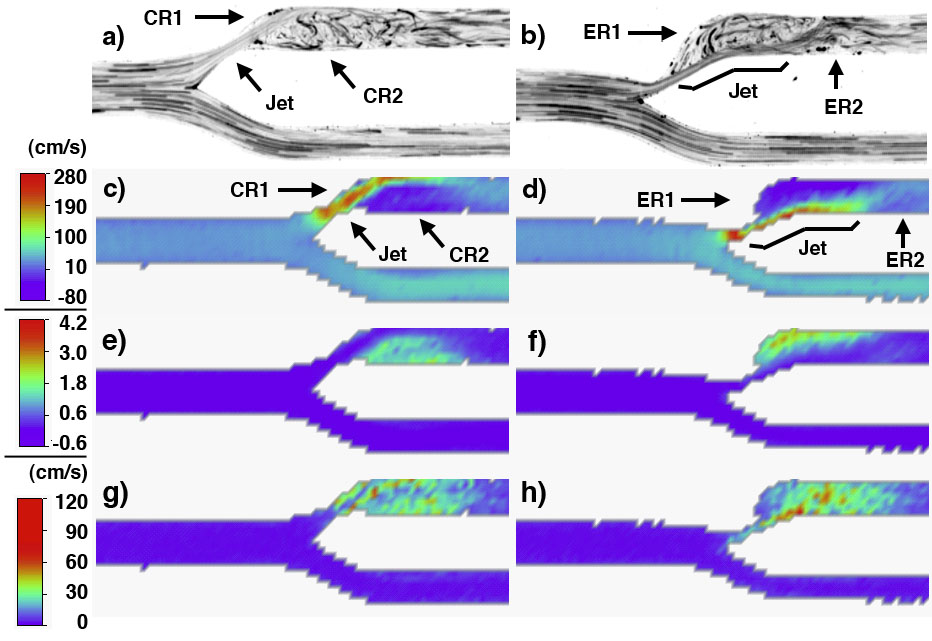
Comparison of DPI and colour-encoded DUS parameter maps Comparison of digital particle imaging (DPI) and Doppler ultrasound (DUS) flow maps for carotid bifurcation models with 70% concentric stenosis (left panels) and 70% eccentric stenosis (right panels) at peak systole. Panels show DPI (a,b), DUS mean velocity (c,d), DUS spectral broadening index (e,f), and DUS turbulence intensity (g,h) with corresponding colour bar on the far left. Flow proceeds from the common carotid artery (left) and divides into the internal (top) and external (bottom) carotid arteries. The different jet paths and recirculation zones are indicated in the concentric (CR1, CR2) and eccentric (ER1, ER2) models, respectively. |
 1.6 MB Quicktime or 2.1 MB AVI |
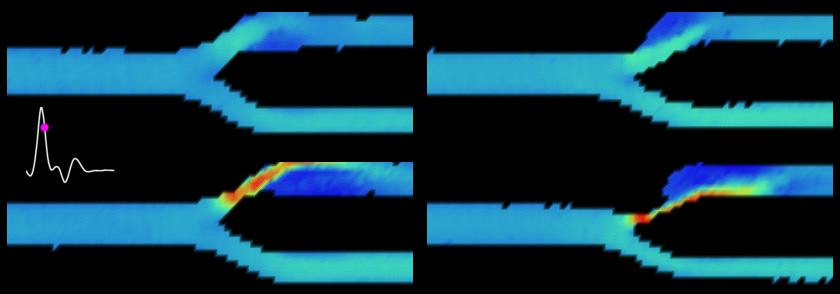
Movie of colour-Doppler ultrasound emulations in the carotid bifurcation Images show a central-plane map of the mean velocity for pulsatile flow in agar phantoms with 30% (top) and 70% (bottom) stenosis severity (by NASCET standards) for concentric (left) and eccentric (right) geometries. The single cardiac cycle of pulsatile flow represents the ensemble average of 10 full cardiac cycles. Article: Poepping et al., UMB 2010 (PubMed abstract) |
 1.5 MB Quicktime or 2.3 MB AVI |
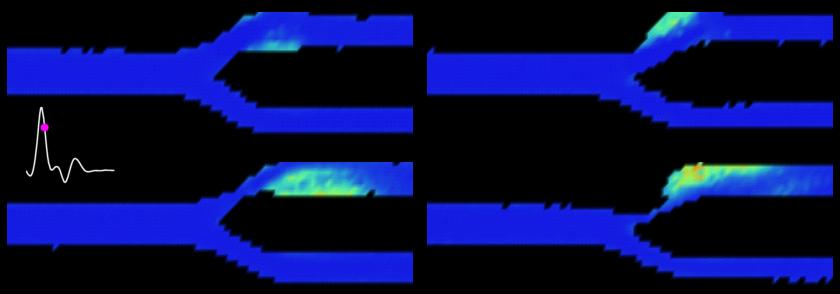
Movie of spectral broadening index derived from Doppler ultrasound measurements in a carotid bifurcation model Images show a central-plane map of the spectral broadening index (SBI; 1-Vmean/Vpeak) for pulsatile flow in agar phantoms with 30% (top) and 70% (bottom) stenosis severity (by NASCET standards) for concentric (left) and eccentric (right) geometries. The single cardiac cycle of pulsatile flow represents the ensemble average of 10 full cardiac cycles. |
 3.0 MB Quicktime |
Movie of digital particle imaging of the carotid bifurcation Images show a central-plane map of pulsatile flow over one cardiac cycle in phantoms with 70% stenosis severity (by NASCET standards) with concentric (top) and eccentric (bottom) geometries. Compare with CFD simulations by D.A. Steinman in the same geometries. |
 3.2 MB Quicktime or 3.0 MB AVI |
Movie of digital particle imaging of the carotid bifurcation Images show a central-plane map of pulsatile flow over one cardiac cycle in phantoms with normal (disease-free) geometry (top) and with mild, concentric stenosis severity (30% by NASCET standards) (bottom). Compare with CFD simulations by D.A. Steinman in the same normal (disease-free) geometry. Study of effect of stenosis eccentricity: Comparison of DPI and CFD in models with mild (30%) stenosis of different eccentricity: Steinman et al, Ann Biomed Eng 2000, 28:415-23 (PubMed) |
 120 kB JPEG |
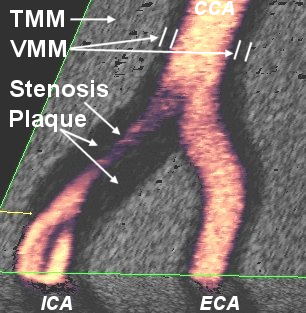
3-D power-Doppler ultrasound image of flow in an ultrasound-compatible vascular phantom Image shows a cut-away view from a 3-D image volume of a carotid bifurcation phantom (see above). The silicone vessel-mimicking material (VMM) is embedded in a gel-based, ultrasound-compatible tissue-mimicking material (TMM) with particle scatterers. The silicone vessel has a further hypoechoic silicone plaque forming a constricted flow channel (i.e. stenosis). Flow from the common carotid artery (CCA), at the top, branches into the internal carotid artery (ICA) and external carotid artery (ECA). Flow accelerates through the stenosis in the ICA, forming a vortex downstream, which is indicated by the drop in ultrasound power (black swirl within vessel lumen). Article on phantom: Poepping et al, Ultrasound Med Biol 2004, 30:1067-78 (PubMed) |
 170 kB JPEG |
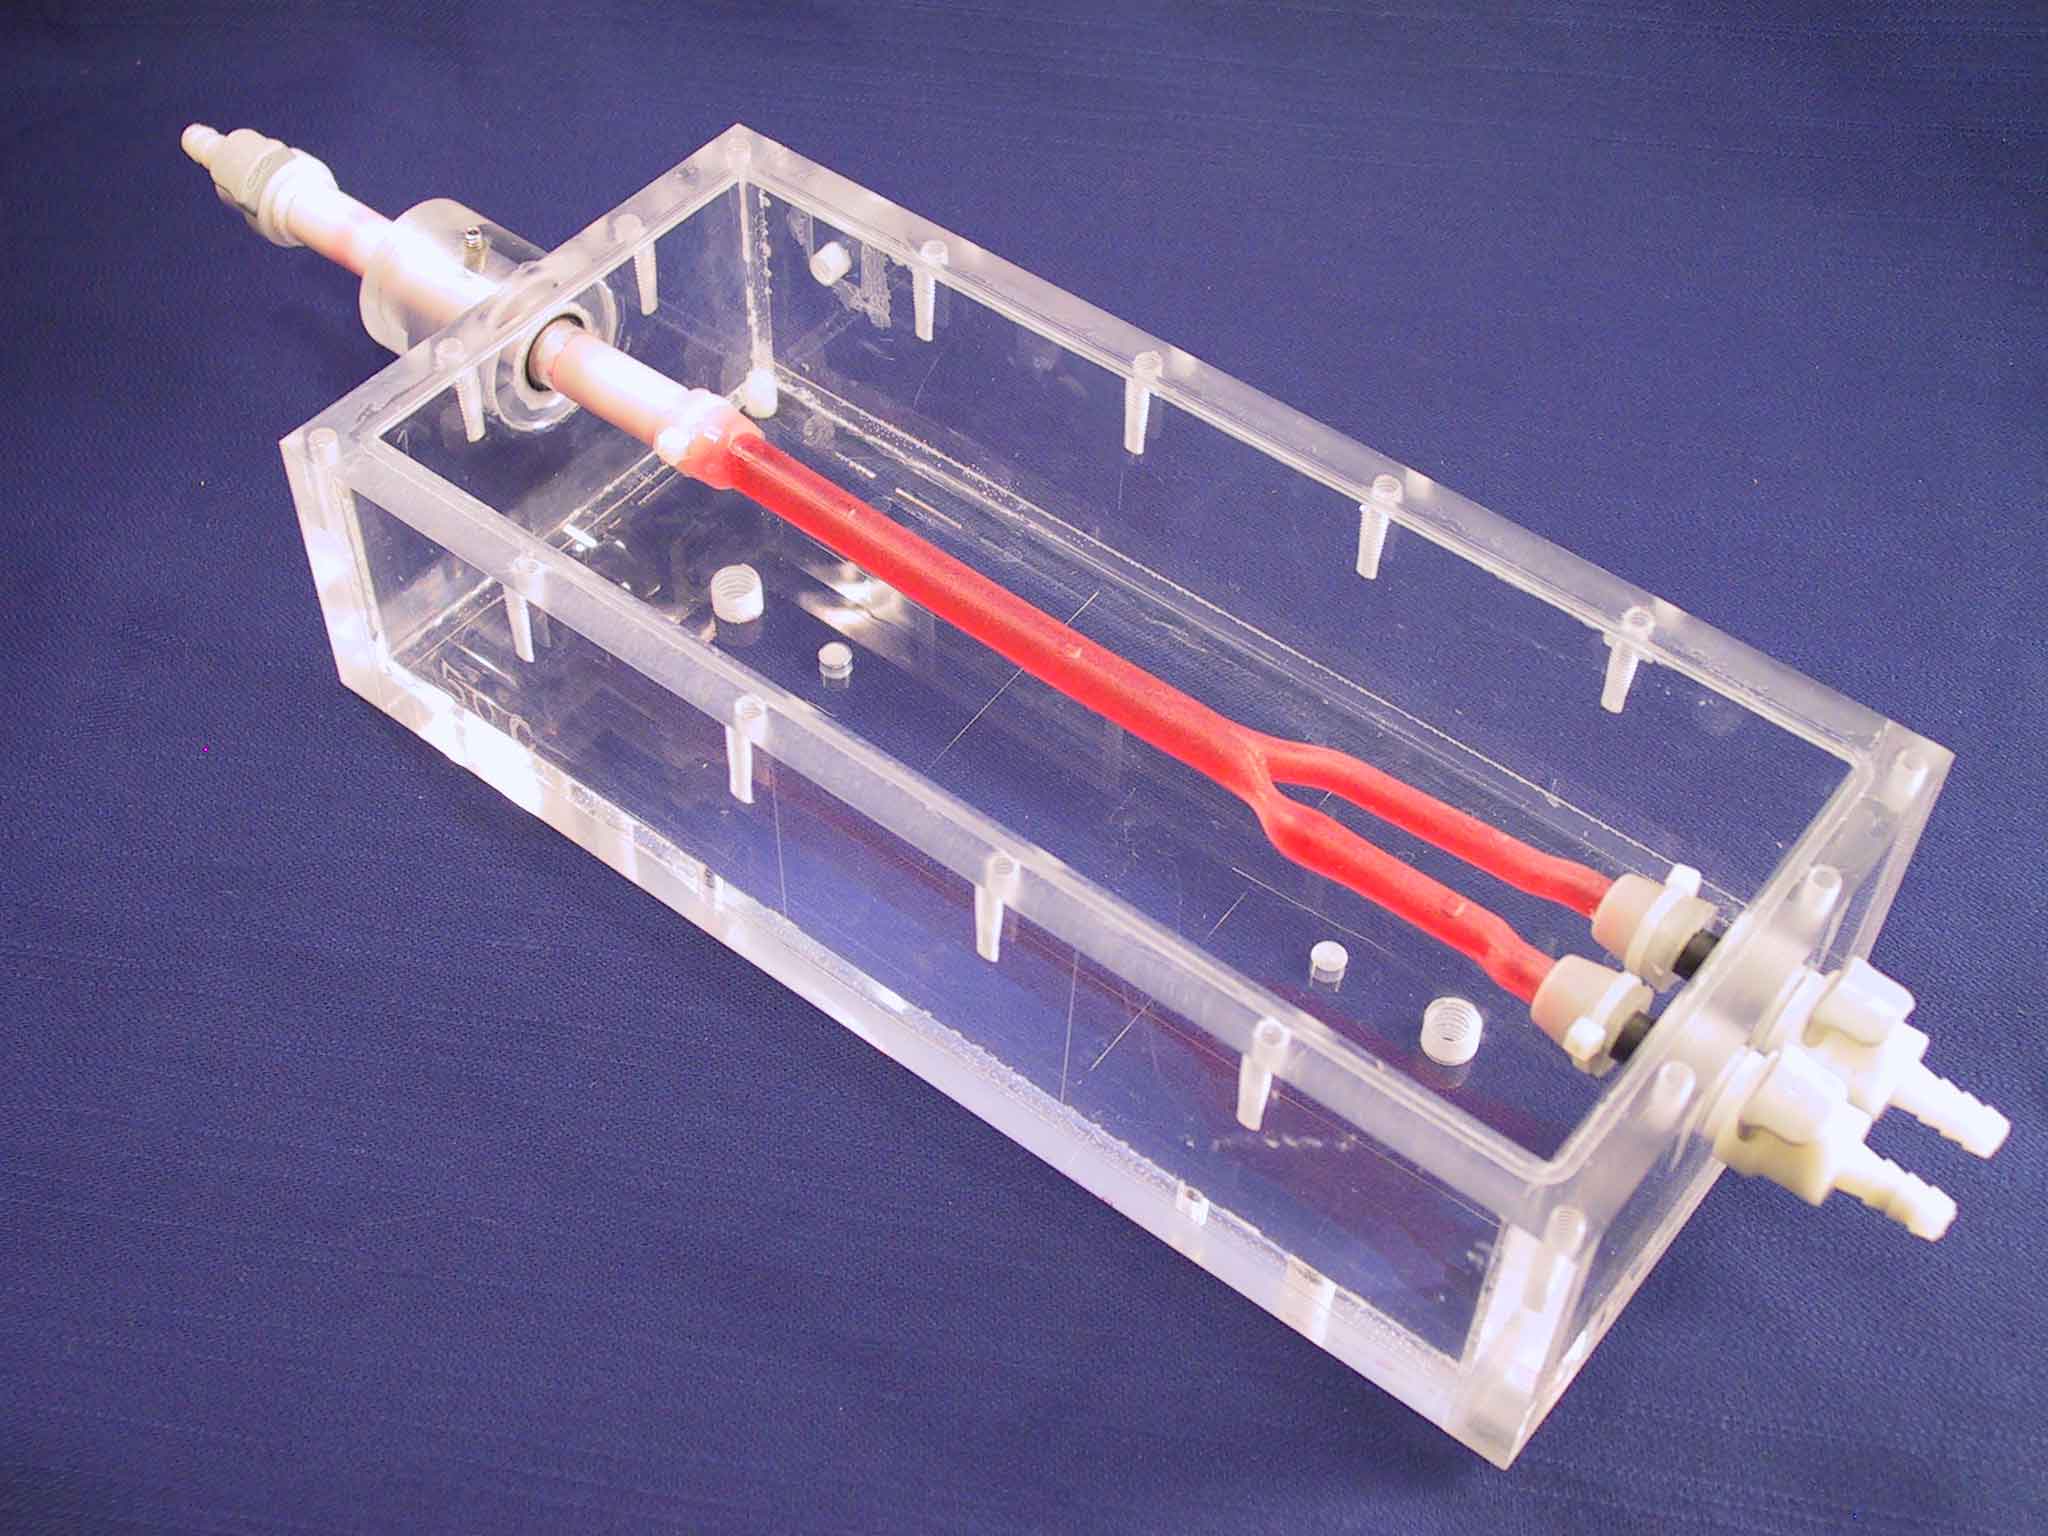
Ultrasound-compatible vascular phantom during fabrication Image shows a thin-walled silicone vessel based on an idealized geometry of a carotid bifurcation The vessel is to be further embedded in a gel-based, ultrasound-compatible tissue-mimicking material (TMM). Geometry: RF Smith et al, Acad Radiol 1996, 3:898-911 (PubMed). Phantom: Poepping et al, Ultrasound Med Biol 2004, 30:1067-78 (PubMed) |
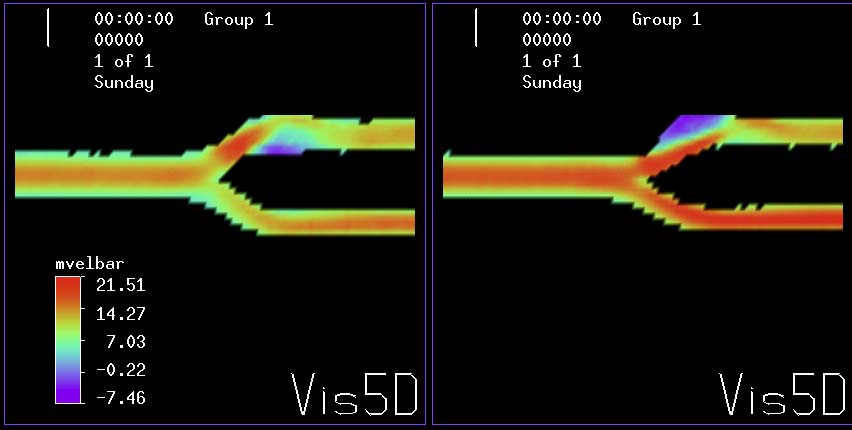 43 kB jpeg |
Emulations of colour-Doppler ultrasound images of the carotid bifurcation Flow enters the common carotid artery (CCA) (left inlet) and divides into the internal carotid artery (ICA) (on top) and external carotid artery (ECA)(on bottom). The ICA supplies blood to the brain while the ECA supplies the face and neck. The ICA is a common site of atherosclerosis, which can lead to a narrowing or stenosis of the artery. This in turn may later cause emboli production which can lead to ischemic stroke. |