1. Introduction
The earliest instruments used to monitor weather involved
the senses of the human body - especially sight, touch (feel), smell,
and hearing.
To some extent, even today these are the most important
instruments because, afterall, we study weather because we want
to know how it will impact our daily lives, and it is through
our senses that we interact with the world around us. This human
sensitivity to weather is illustrated in the attached
diagram (click the diagram to see an enlarged version of it).
Mankind and Weather
Note that as a general rule throughout this text, you may click on any diagram to see an enlarged view of it. The new image will appear in a new "pop-up" window. Close the pop-up window by clicking on the "x" in the top right hand corner.
The principle parameters which we study in relation to "weather" and "climate" are:
(i) Air temperature
(ii) Air pressure
(iii) Humidity
(iv) Clouds - existence of, types
(v) Precipitation (rain, snow hail etc.)
(vi) Visibility
(vii) Wind
(viii) Solar radiation
Once these parameters are known, other parameters such as dew point, relative humidity, frost point and so forth may be determined as "secondary parameters".
Despite the fact that these different phenomena affect our lives in many ways, it turns out that the human body is not particularly good at quantifying these characteristics. Water which feels cold to one person may feel warm to another, depending on what that person has been doing. For example, after a swim in an ice-cold lake, even water at air temperature may seem warm, whereas a person who has not been immersed in such conditions recently may consider the same water as cool.
In addition, sometimes we are simply not very good at quantifying things. An example is wind speed. We can get an impression of wind speed by how severely it blows the leaves on the trees around, but that isn't too effective in winter if there are no leaves on the trees. One can get a crude sense of direction by watching where objects are blown, or by holding a wetted finger up in the breeze and finding the orientation which produces the fastest cooling. But these methods are only approximate, and it became evident to early observers that more quantitative measuring instruments were needed.
2. A Brief History of the Early Instruments of Meteorology
The earliest instruments were quite simple, and serious studies of the atmosphere from a scientific perspective did not really begin until the 1800's. Before that, instruments were very simple. Examples include thermometers, and weathervanes.


 were another form of early instrument, and occasionally pressure was measured
in an approximate manner (see shortly).
were another form of early instrument, and occasionally pressure was measured
in an approximate manner (see shortly).
Even with these tools, application was often only qualitative. For example, weather-vanes (often with a metal replica of rooster added for aesthetic effect (in which case they were called "weather-cocks")) were used for little more than determining the general wind direction e.g. whether it was blowing from say the north or north-west. Cup anemometers gave a measure of the wind speed, but this figure was not always quantitatively recorded.
In the 1800's, several scientists began taking more detailed measurements.
They also became curious about the atmosphere in a broad sense, including
the upper atmosphere. Examples of this type of work were the efforts
of James Glaisher (1809-1903), who became curious about what lies
"above" us, and was the first person to fly a balloon to great altitude.
In 1862 he and his pilot achieved an altitude of something in the range
29,000 to 36,000 feet (no-one quite knows for sure)
(about 9000-11,200 metres - the same
height as Mt. Everest), at which point he fainted due to the lack of
oxygen, low pressures
and cold temperatures. He measured a pressure at this height of about
one third of the ground-level pressure. His balloon pilot, although
also near unconsciousness,
was able to open a control valve with his teeth and thereby allow the
balloon to float downwards again. The attached picture shows the pilot
releasing the valve at this critical juncture.
 Glaisher's pilot releases the valve.
There were several critical periods in the development of meteorology, and the scientific application of measurement tools was one of these. Other critical periods include the development of sophisticated computer simulations for weather forecasting, and the advent of the space-age, with weather satellites being placed into space.
3. Modern Instruments
In the following sections, we will describe various types of modern meteorological tools. We will begin with the lower atmosphere, but will also discuss instruments for measurements at heights to 100 km in altitude at a later point. We will also briefly allude to more modern developments.
Modern instruments can be used alone, but they are most productive when used in collaboration with other instruments. Often instruments are placed together in a WEATHER STATION.
Weather stations usually measure pressure, temperature, daily maximum and minimum temperature, wind speeds, wind directions, humidity, cloud cover, solar radiation (often at several wavelengths), and precipitation. A good weather station must meet quite stringent requirements. For example, they must be in an open field, so that local buildings and obstructions do not distort their measurements of wind speed and direction. They must be free of shade, and must meet other important criteria. All instruments also need to be carefully calibrated, and regularly serviced.
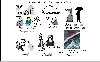
The following photographs show examples of the types of instruments used (click on the small photographs to see enlargements).
Thermometers
are some of the simplest instruments, and measure
temperature.
The first thermometer was invented by Galileo in 1592.
The simplest thermometers use expansion along a tube of a liquid such as
alcohol or mercury as an indicator of temperature. There are
also adaptations of this principle which permit the thermometers
to be used to determine daily maximum and minimum temperatures.
For example, the temperature maximum can be found using a special
thermometer in which the tube holding the mercury is "pinched"
in at one point, so that Mercury may pass through it, but when the
Mercury recedes as the temperature cools, the portion above the
pinched section remains. As such it acts like a small valve, leaving
the mercury behind so that the maximum temperature can be read later.
I will not discuss these maximum- and minimum-temperature thermometers
in more detail here - there is quite a lengthy discussion on pages
75 to 77 of your text book (C.D. Ahrens, Meteorology Today, 6th ed.,
Brooks/Cole/Thomson Learning Book Co.)
However, it should be noted that not all thermometers use expansion of a liquid in a glass column like the one shown here. Modern devices often are built so that the temperature can be digitized onto a computer, and therefore use electronic means to measure the temperature. For example, some thermometers employ the fact that the electrical resistance of resistor elements changes as a function of temperature. Others use the properties of thermocouples. If it is possible to record the temperature digitally, there is of course no need to have special devices to determine temperature maxima and minima, since it is easy to record the data at small time steps over the whole day, and then use software to search the data base for local maxima and minima.
Pressure
sensors take a variety of forms. The first one was invented by
Torricelli in 1643. Earlier ones include
aneroid barometers
 and
Mercury barometers.
and
Mercury barometers.

As shown in the picture of the aneroid barometer, this instrument relies on a sealed, flexible unit which contains air at a fixed volume. As the atmospheric air pressure changes, this membrane expands and contracts, altering the position of a needle on the barometer. Mercury barometers use an evacuated tube, and Mercury rises or falls within this tube as the atmospheric pressure changes, pushing the Mercury higher or lower in the tube.
Some more sensitive instruments rely on other features related to pressure. For example, so-called "micro-barographs" are sufficiently sensitive that they can detect pressure changes as small as 1 Pascal or less, and these use tiny silicon diaphragms attached to a capacitance gauge to perform their measurements. The diaphragm bends to different degrees depending on the external pressure, altering the capacitance of the attached capacitor. Data from these instruments can easily be recorded digitally, allowing high time-resolution studies of pressure-wave events in the atmosphere. They usually need to be carefully calibrated against more conventional microbarographs.
Rain gauges
will be the next item we discuss. These essentially comprise
carefully calibrated collecting buckets.
The unit of rainfall that is used is equal to the depth of water
which would have
resulted on the ground if none of the water which fell could
escape (either by seepage into the ground, or by evaporation) and
if the water were spread uniformly over the whole ground.
Thus a rainfall of "15 mm" means that if all of the rain were spread
uniformly across the landscape, it would have had a depth of 15 mm.
Examples of rain gauges are shown
here.
 The first one is a standard instrument, whilst the second is designed
for continuous recording. In this second case, water from the collecting
container drains onto another container which rests on a weighing scale.
The weight of the precipitation raises the arm of a recording pen,
which records the amount recorded on a paper chart.
The first one is a standard instrument, whilst the second is designed
for continuous recording. In this second case, water from the collecting
container drains onto another container which rests on a weighing scale.
The weight of the precipitation raises the arm of a recording pen,
which records the amount recorded on a paper chart.
In order to allow automation and digitization, some modern rain-gauges (called "tipping bucket rain-gauges") tip their contents out onto a measuring scale at regular intervals, (e.g. 1 minute) and the contents are electronically weighed and stored digitally. The total accumulation can be determined by summing all the weights over the course of the rain event.
Wind instruments
will be our next topic. Measurements of the wind require two parameters -
speed and direction. Direction is usually determined by a weathervane,
and there are various types of these. We have seen some earlier examples
already e.g.
, but more modern ones tend to be less aesthetic and more practical.
They also usually contain an attached instrument for measuring wind
speed as well. Examples are shown below.

Wind measuring instruments of this type usually are referred to as wind anemometers. Because the tails of the vanes are designed to face away from the wind, they are usually organized with a point on the other side which points into the wind. Hence they indicate the direction from which the wind comes.
Other forms of wind anemometers exist, such as
the one indicated
here,
 which uses a fan to measure the wind speed, and contains the weather vane
as its tail.
It is also possible to obtain hand-held wind-speed anemometers like the
one shown
here.
which uses a fan to measure the wind speed, and contains the weather vane
as its tail.
It is also possible to obtain hand-held wind-speed anemometers like the
one shown
here.
 These are not as reliable for absolute measurements, but are very portable,
and convenient for making occasional measurements at sites which do not
have a more sophisticated instrument. The observer needs to face the
instrument into the wind and record the numerical output displayed
below the fan.
These are not as reliable for absolute measurements, but are very portable,
and convenient for making occasional measurements at sites which do not
have a more sophisticated instrument. The observer needs to face the
instrument into the wind and record the numerical output displayed
below the fan.
Cloud height and visibility
are two other important parameters which are required for meteorological
measurements. Both use optical beams of various types - often lidars.
For example,
ceilometers
 determine the base of the cloud height by sending
up pulses of light towards the cloud. Upon encountering the cloud,
the light pulses are (partially) reflected to the ground, where they
are detected.
The time delay between transmission and reception of the light pulses
is used to determine the base height of the clouds.
Visibility instruments usually measure the reduction of intensity
of narrow light beams as they traverse across a designated region.
determine the base of the cloud height by sending
up pulses of light towards the cloud. Upon encountering the cloud,
the light pulses are (partially) reflected to the ground, where they
are detected.
The time delay between transmission and reception of the light pulses
is used to determine the base height of the clouds.
Visibility instruments usually measure the reduction of intensity
of narrow light beams as they traverse across a designated region.
In relation to clouds, it is also not uncommon to record the percentage of cloud cover, and often all-sky cameras are used to do this. A simple all-sky camera can be made by photographing the image seen in a highly polished metal sphere with a radius of typically 15-30 cm.
Some meteorological sites also include special sensors to measure solar radiation . Sometimes this is done over all wavelengths, and sometimes it is done in discrete wavelength bands. The ultra-violet visible band is a common one to observe, due to its importance in relation to ozone loss, but other common wavelengths include those at which plants are most sensitive (particularly useful for horticulture and gardening).
Humidity is another important quantity in meteorology (both absolute and relative humidity), but in the earlier times it proved very hard to quantify, even though human beings are very sensitive to it. The history of the measurement of humidity is quite fascinating, and involves some quite ingenious developments.
One of the earliest instruments for such measurements in fact drew from
human sensitivity to humidity, and in particular the sensitivity of
human hair! The attached figure shows an early example of a
Hygrometer,
 This instrument uses the fact that human hair changes in length in response
to changes in humidity, with the hair becoming longer when the relative
humidity increases. Thus as the humidity changes, so the needle adjusts
in position, in response to changes in the length of the hair.
This instrument uses the fact that human hair changes in length in response
to changes in humidity, with the hair becoming longer when the relative
humidity increases. Thus as the humidity changes, so the needle adjusts
in position, in response to changes in the length of the hair.
Such an instrument may seem to be a curiosity, but in fact humidity
measuring instruments which depended on human hair were common
for many years. The attached photograph shows a
Hygrothermograph.
 This instrument records both humidity and temperature to a paper chart
(hence the trailing syllable "graph", rather than "meter", to indicate that
the instrument creates a graph as time evolves). It is shown with
its cover removed (the cover is at the left-hand end of the
picture). This instrument
was in use even as recently as twenty years ago, and once again depended on
human
hairs to measure humidity. The human hairs may be seen stretching from
top to bottom on the right-hand end of the instrument - in this case there
are several hairs, forming a ribbon of hair, rather than a single hair.
This instrument records both humidity and temperature to a paper chart
(hence the trailing syllable "graph", rather than "meter", to indicate that
the instrument creates a graph as time evolves). It is shown with
its cover removed (the cover is at the left-hand end of the
picture). This instrument
was in use even as recently as twenty years ago, and once again depended on
human
hairs to measure humidity. The human hairs may be seen stretching from
top to bottom on the right-hand end of the instrument - in this case there
are several hairs, forming a ribbon of hair, rather than a single hair.
Another important option which may be used to measure humidity is the
Psychrometer.
 The instrument shown here
has the full name of the Assmann ventilated psychrometer.
A spring-driven motor, wound up by a key at the bottom, operates a fan that
draws air across the bulbs of two thermometers. The bulb of one of the
thermometers is covered with a muslin wick, which is moistened with
distilled water. This wet-bulb thermometer is cooled by evaporation
(due to the air stream passing over it, which is generated by the fan)
to a value below the temperature shown by the dry-bulb thermometer.
The computation of the humidity is carried out by comparing the two readings
of the thermometers, since the difference between them depends on humidity and
pressure (the pressure is measured independently using a barometer).
In fact the Assmann ventilated psychrometer was actually developed
to be a portable instrument, to be flown on balloons - something
that the hygrometers could not be used for.
The instrument shown here
has the full name of the Assmann ventilated psychrometer.
A spring-driven motor, wound up by a key at the bottom, operates a fan that
draws air across the bulbs of two thermometers. The bulb of one of the
thermometers is covered with a muslin wick, which is moistened with
distilled water. This wet-bulb thermometer is cooled by evaporation
(due to the air stream passing over it, which is generated by the fan)
to a value below the temperature shown by the dry-bulb thermometer.
The computation of the humidity is carried out by comparing the two readings
of the thermometers, since the difference between them depends on humidity and
pressure (the pressure is measured independently using a barometer).
In fact the Assmann ventilated psychrometer was actually developed
to be a portable instrument, to be flown on balloons - something
that the hygrometers could not be used for.
This Assmann ventilated psychrometer is in fact an adaptation of a much older instrument called the "sling psychrometer", which works on the same principle as the Assman unit. However, with the sling psychrometer the air flow which causes the evaporation from the wet-bulb is not generated by a fan, but rather by whirling the unit around one's head at high speed. As with the Assman unit, the humidity is read from a table which specifies the relation between the temperature difference on the wet and dry bulb thermometers, and the (relative) humidity. Such a table can be found, for example, in Aguado and Burt, "Understanding Weather and Climate", 2nd ed., Prentice-Hall, p. 103. A similar table can also be found in appendix D of your text book.
More recent humidity meters use a capacitor which consists of two metal plates separated by a thin polymer film. The film absorbs or exudes water vapour as the humidity increases or decreases, thus changing the dielectric constant of the film. This in turn changes the capacitance of the unit, which can be recorded electronically. The capacitance can then be converted to a measure of humidity using suitable conversion formulae. These instruments are very portable and can be calibrated to quite high accuracy.
Other instruments that are used to measure the humidity include the electrical hygrometer, the infrared hygrometer, the dew-point hygrometer and the dew cell. The electrical hygrometer passes an electrical current through a carbon-coated plate, and measures the change in resistance across the plate due to absorption or release of water vapour as the humidity changes. The infrared hygrometer measures the absorption of infrared light as it passes through air, with absorption being greater when the absolute humidity is greater. The dew-point hygrometer measures the temperature at which condensation is produced on a cold plate, and uses this information to work out the humidity. Finally, the dew cell actually measures the vapour pressure of the air directly. See the text book on page 121 for further discussion of this device (last paragraph on the page).
This summarizes the main surface level instruments, although the list is certainly not complete. We now turn to measurements above the surface.
4. Upper Atmosphere Instruments
While measurements at ground level are clearly important, scientists have long recognized that it would be necessary to measure at higher altitudes as well if we were ever to really understand our atmospheric environment. We have already mentioned the balloon flight of James Glaisher, but more sustained upper level studies really began towards the end of the 1800's, and into the early 1900's, with the work of R. Assmann (1845-1918) and L. P. Teisserenc de Bort (1855-1913). These scientists developed various instruments which could operate while being flown on kites and balloons. An example is the Assmann ventilated psychrometer, which we have already discussed. These scientists then developed the art of flying their instrument collectives on kites, in aircraft and under balloons. However, they still needed to collect the instruments to record the data.
For a long time kites were a mainstay of meteorological measurements,
like the
box kite
 shown here. They were used to carry instruments aloft, and then
could be reeled in and the equipment recovered.
shown here. They were used to carry instruments aloft, and then
could be reeled in and the equipment recovered.
Even nowadays, kites are sometimes used for special research studies.
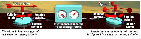
The following picture shows a pair of kites (one red, one black) used
in some
recent experiments.
 Other modern researchers have used
special kites shaped like the parachutes used in modern stunt-parachuting,
and have reached heights of several thousand metres using these devices.
Other modern researchers have used
special kites shaped like the parachutes used in modern stunt-parachuting,
and have reached heights of several thousand metres using these devices.
The current record for the highest altitude achieved by a single kite
appears to belong to a Canadian, Mr. Richard Synergy, who reached
a height of around 4km altitude in August 2000. You can see his web site at
Richard Synergy's web site
Nevertheless, kites were eventually replaced as the main upper atmosphere
platforms, as we shall soon see.
A major advance in upper air studies came with the development of radio techniques which permitted the information stored on the instruments to be transmitted back to the ground, so that even if the balloon was lost, the user would still have a copy of the information. Vaisala in Finland was a key player in this field, and his work in this area led to the development of the Vaisala company, one of the largest builders of meteorological equipment in the world today.
Nowadays, balloons are launched from thousands of sites around the world, carrying special packages which record temperature, pressure and humidity. Typically these balloons are all launched twice per day, at 0000 and 1200 Greenwich Mean Time, although other times can certainly be used for special experiments. Radio methods are also used to track the balloons (either using navigation systems or GPS techniques), so that the wind speeds at upper heights can also be determined.
Due to the decrease of the atmospheric pressure outside of the balloon, the balloons expand as they rise, in order to maintain pressure equilibrium on the inner and outer surfaces of the balloon. Eventually the balloons become so large that they burst, at which point they fall back to earth. Typically a balloon will reach an altitude of 20-25 km, but specially designed balloons can reach heights of 35 km.
Balloon studies really began in a co-ordinated manner in the
early to mid 1900's. The next photographs show examples of
balloons about to be released during world war II.
 (WWII Balloon release).
 (WWII Balloon release).
Examples of more recent balloon releases are shown in the following
pictures.

 (Click pictures for enlargements.)
These balloons carry radiosondes aloft with them. Over the years these instruments have become smaller and lighter. They are also relatively cheap - typically in the range of $100 to $200. Generally the balloons fly to an upper altitude of around 20 km, where-upon they burst, as we have already described. By the time they burst, they have often drifted horizontally by as much as 100 km (depending on wind conditions). In some cases small parachutes are attached to the radiosondes, and they float down and can occasionally be recovered. More often than not, however, the radiosondes are sent up without a parachute, and the radiosonde just falls to earth and is lost. The expense of recovering these radiosondes usually exceeds the cost of building new ones for each flight. The sondes are usually made with a large percentage of styrofoam, so they are light enough that they cause no damage if they hit an object on the ground.
The radiosondes themselves have evolved considerably over the years.
Current sondes are very light-weight, and use very tiny sensors
to determine temperature, pressure and humidity. The next figure shows
a typical modern radiosonde.
 Vaisala RS80 radiosonde.
The actual sensors are on a small arm which protrudes from the
cardboard casing during flight. The whole system is powered by
a water-activated battery.
Vaisala RS80 radiosonde.
The actual sensors are on a small arm which protrudes from the
cardboard casing during flight. The whole system is powered by
a water-activated battery.
The next
image
 .
shows a radiosonde after it has been opened up
for examination. The main electronics are situated on a small
printed-circuit board slipped into the styrofoam casing (at the
back of the picture). The arm pointing out to the bottom holds the
sensors for determining temperature and humidity.
.
shows a radiosonde after it has been opened up
for examination. The main electronics are situated on a small
printed-circuit board slipped into the styrofoam casing (at the
back of the picture). The arm pointing out to the bottom holds the
sensors for determining temperature and humidity.
The next picture shows a
schematic
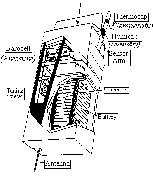 (click to enlarge)
of a typical radiosonde.
(click to enlarge)
of a typical radiosonde.
The next image shows a view of the
electronic circuit board
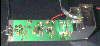 which forms the backbone of the electronics of the system,
and which acquires the data and transmits it back to the receiver at the
ground.
which forms the backbone of the electronics of the system,
and which acquires the data and transmits it back to the receiver at the
ground.
It was mentioned earlier that, in addition to "standard" radiosonde balloons
like the ones just shown, there are also special balloons of larger
size which can achieve greater altitudes before they burst. These often
carry ozonesondes with them, and are especially designed to measure
ozone in the stratosphere. An example is shown in the following picture.
 (Click to enlarge.)
These instruments are of special importance nowadays, in view of recent
concern about loss of stratospheric ozone due to man-made (anthropogenic)
influences.
(Click to enlarge.)
These instruments are of special importance nowadays, in view of recent
concern about loss of stratospheric ozone due to man-made (anthropogenic)
influences.
Interestingly, balloon technology has had a considerable rebirth lately.
Examples include recent attempts to build balloons which can stay
aloft for sufficient time that they can circumnavigate the world.
The first to do this were Piccard and Jones, who flew around the globe
in March 1999 in the craft
Breitling Orbiter 3.

You can read more about this in the November, 1999 issue of "Scientific American". A great deal of modern technology was needed in order to make a balloon which could stay aloft for sufficiently long, and there was also a need for strong involvement from meteorologists to direct the balloon into the right wind conditions to ensure its continued forward motion.
Another common form of "upper air" platform is instrumented aircraft. Aircraft can exist which can fly to great heights - even into the stratosphere- and these are often used for special experiments. Such aircraft have even been flown into the middle of hurricanes.
5. Rockets and Satellites
In the previous section, we implicitly treated any part of the atmosphere above ground-level as the "upper atmosphere". In fact, scientists have somewhat stricter nomenclature. You are aware of the layers of the atmosphere which are defined by temperature mean gradients i.e. the troposphere, stratosphere, mesosphere and thermosphere. But scientists also use another classification. The region from 10 to 100 km altitude is often called the middle atmosphere, and the region above 100 km is then the "upper atmosphere". For many years the "middle atmosphere" was often referred to as the "ignorosphere", as we were ignorant of its characteristics. However, in the years from 1980 to 2000, many scientists (including this particular author!) have worked vigorously to improve our understanding of this region. This has been done especially with high altitude balloons, radars, optical sensing and imaging techniques, lasers and lidars, rockets and satellites. Other interesting tools have included studies of meteors, and even studies of sound propagation. (Interestingly, the stratosphere was first surmised because of casual observations by observers in relation to the sounds of explosives being detonated in WWII - it turned out that observers close to the source, and hundreds of kilometres from the source, could often both hear the sounds, but intermediate observers could not. This was speculated to be due to a layer of warm air above the troposphere refracting the sound waves back down to the ground at large distances, and this speculation eventually proved correct. More details about these earlier types of studies can be found in a book by A.P. Mitra entitled The Upper Atmosphere, Asiatic Society, Calcutta, 1952. Note that in the 1950's, 60's and early 70's, the region that we now call the "middle atmosphere" was considered as part of the "upper atmosphere").
I will not discuss all of these techniques here. The discussion of radar is left to another section of this course, and I have already said something about balloons. A useful discussion about lasers and lidars can be found at pcl.physics.uwo.ca and click on "General Introduction to Lidar". (Click on the "back" arrow at the top left hand corner of the screen to return to this page.) Passive optical methods will not be discussed here, although they are a powerful class of techniques in their own right, and can be used to produce detailed images of the structure of wave events in the middle atmosphere. My concentration here will be on rocketry and satellites.
5(i) Rockets
Use of rockets for atmospheric studies began after world war II, when
the U.S. military began testing
V2 rockets
 which had been developed in Germany as weapons of war, and which the
US had confiscated. Their tests involved flying the rockets to high
altitude, and since they would be flying through height regimes which
were previously unknown, they offered the opportunity to scientists for
them to add scientific instrumentation on board. The types of
instruments which were added were simple, and included temperature
and pressure measuring equipment, equipment for measuring cosmic rays,
and equipment for studying the ionosphere. Telemetry was also
added so that the instrument information could be transmitted
back to receivers on the ground for recording. A schematic of the
"payloads" of one of these earlier rockets is shown
here
which had been developed in Germany as weapons of war, and which the
US had confiscated. Their tests involved flying the rockets to high
altitude, and since they would be flying through height regimes which
were previously unknown, they offered the opportunity to scientists for
them to add scientific instrumentation on board. The types of
instruments which were added were simple, and included temperature
and pressure measuring equipment, equipment for measuring cosmic rays,
and equipment for studying the ionosphere. Telemetry was also
added so that the instrument information could be transmitted
back to receivers on the ground for recording. A schematic of the
"payloads" of one of these earlier rockets is shown
here
 (click to enlarge).
Such flights were the beginnings of middle atmosphere rocketry research.
(click to enlarge).
Such flights were the beginnings of middle atmosphere rocketry research.
After those early flights, and especially in the 1960's and 1970's,
scientists started developing their own rockets for middle atmosphere
research. These rockets were smaller than the V2's, but were especially
designed for scientific payloads. Examples of such smaller rockets are
shown in the next images, which show first a rocket on its
launch-pad,
 and then a view of the rocket just after
lift-off.
and then a view of the rocket just after
lift-off.
 (click to enlarge).
These rockets carry a variety of different payloads, and the compositions of the payloads vary from rocket to rocket, depending on the planned experiments. Examples include pressure sensors, density sensors, mass spectrometers, dust detectors (for detecting meteoric dust), ion gauges, Langmuir probes, electron density gauges, and many others. Scientists are continually thinking of new experiments to perform, because the middle atmosphere is a fascinating region, containing phenomena relating to both neutral and plasma dynamics. In the section below I will highlight just some of the many experiments performed. It should also be noted that measurement of temperatures at these high altitudes is not simply a matter of flying a thermometer through the region, because the very low densities (and associated large molecular mean free paths) and the high rocket speeds (kilometres per second)make it difficult for slower sensors to respond fast enough to make meaningful measurements. Special techniques need to be employed even for a measurement as "simple" as temperature, and past experiments have utilized experiments like measuring the speed of sound in the different height regimes using grenade explosions as sources, and measurements of atmospheric scale heights from pressure and density variations with altitude.
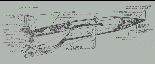
Winds and dynamical motions form a key subject for investigation at these
high altitudes. The winds are very large and highly variable, especially
at heights of 80 to 100 km. One early method for measurement of upper
level winds was to release a trail of luminescent gas behind the rocket
as it flies upward. These particular measurements are best made at sunset
or sunrise. The trail is blown around by the wind, and also develops
a "puffy" appearance due to local turbulence, as shown
here.
 By taking photographs of these trails from the ground using high
resolution cameras, and using multiple cameras so that triangulation
can be used, it is possible to determine both the upper level winds (from
the trail drifts), and the strengths of turbulence (from the rate of
expansion of the puffy trail). The numbers on the photograph
indicate height in kilometres, as determined by such triangulation.
It is also interesting to note that
at heights above about 103 km (in this case), the trail is not puffy,
but has a
more "laminar" appearance. This occurs at the higher heights
because turbulence cannot easily develop at these heights, due to
a large increase in the so-called "kinematic viscosity" of the atmosphere.
This latter term is a quantity which indicates how easy (or otherwise)
it is to stir up "eddy motions" in the air - and at the higher
heights, trying to stir up eddies is a bit like trying to
create them in honey! - the upper atmosphere is very viscous.
The transition region between turbulent and laminar motions varies
from one day to the next, but is usually fairly sharp, and somewhere
in the region between 95 and 105 km altitude. It is given the
name turbopause.
By taking photographs of these trails from the ground using high
resolution cameras, and using multiple cameras so that triangulation
can be used, it is possible to determine both the upper level winds (from
the trail drifts), and the strengths of turbulence (from the rate of
expansion of the puffy trail). The numbers on the photograph
indicate height in kilometres, as determined by such triangulation.
It is also interesting to note that
at heights above about 103 km (in this case), the trail is not puffy,
but has a
more "laminar" appearance. This occurs at the higher heights
because turbulence cannot easily develop at these heights, due to
a large increase in the so-called "kinematic viscosity" of the atmosphere.
This latter term is a quantity which indicates how easy (or otherwise)
it is to stir up "eddy motions" in the air - and at the higher
heights, trying to stir up eddies is a bit like trying to
create them in honey! - the upper atmosphere is very viscous.
The transition region between turbulent and laminar motions varies
from one day to the next, but is usually fairly sharp, and somewhere
in the region between 95 and 105 km altitude. It is given the
name turbopause.
Vapour trails work best in the region between 80 and 100 km altitude.
At lower heights, other procedures are used. One example is
the inflatable
falling sphere,
 (shown here being held up in the air by a person)
which is a light-weight shiny metal "skin" which is blown up with air at the
top of the rocket trajectory, and then allowed to fall to the ground.
Because it is smooth and metallic, it can be tracked by radar from the
ground, and by following the motion of this object the upper level
winds can be determined.
Other procedures include release of thousands of tiny metal
"needles", which are again blown around by the wind and can be
tracked by radar.
(shown here being held up in the air by a person)
which is a light-weight shiny metal "skin" which is blown up with air at the
top of the rocket trajectory, and then allowed to fall to the ground.
Because it is smooth and metallic, it can be tracked by radar from the
ground, and by following the motion of this object the upper level
winds can be determined.
Other procedures include release of thousands of tiny metal
"needles", which are again blown around by the wind and can be
tracked by radar.
Many other rocket experiments are carried out, but there is currently no real regular world-wide program of middle atmosphere rocket measurements like the radiosonde program. Much of the information about the long term variability of middle atmosphere winds is determined by radars and satellites. This brings us to out next topic.
5(ii) Satellites
As rockets became more powerful, it was eventually possible to use them to place satellites in orbit. The first successful satellite was lifted to orbit by Russian scientists and engineers on October 4, 1957, and was called Sputnik. Since then, many other satellites have been placed in orbit. Currently there are 8,600 objects in Earth-orbit which have sizes in excess of 10 cm across.
Many of these satellites exist for specific practical purposes,
like telecommunications and military surveillance, but others
are placed there for atmospheric studies. The first specialist
meteorological satellite was the
TIROS satellite,
 which was placed into orbit in 1960.
Here is a view of
which was placed into orbit in 1960.
Here is a view of
 another Research Satellite.
These satellites have many different applications, from monitoring cloud
activity (often at several different optical wavelengths), recording
stratospheric ozone, measuring middle atmosphere temperatures, photographing
hurricanes, and measuring pollutant concentrations. Recent Canadian
satellites have been used to observe the Aurora, measure middle atmosphere
winds (WINDII, which is a special optical instrument on the
UARS satellite
another Research Satellite.
These satellites have many different applications, from monitoring cloud
activity (often at several different optical wavelengths), recording
stratospheric ozone, measuring middle atmosphere temperatures, photographing
hurricanes, and measuring pollutant concentrations. Recent Canadian
satellites have been used to observe the Aurora, measure middle atmosphere
winds (WINDII, which is a special optical instrument on the
UARS satellite
 ), and measure pollutant concentrations (MOPITT).
Satellites offer a global coverage which is not possible with any
other single instrument, and will no doubt be major instruments in all
future work, but they are usually far more efficient if used in parallel
with ground-based instruments like radar and radiosondes. The future
of atmospheric research will undoubtedly involve all of the many
instruments which I have discussed.
), and measure pollutant concentrations (MOPITT).
Satellites offer a global coverage which is not possible with any
other single instrument, and will no doubt be major instruments in all
future work, but they are usually far more efficient if used in parallel
with ground-based instruments like radar and radiosondes. The future
of atmospheric research will undoubtedly involve all of the many
instruments which I have discussed.
Copyright W.K. Hocking, 2000.
Last updated 31 October 2000